Many people think that science is a difficult subject. The idea of p test is a complex idea that is so unattainable by the general public. But in reality, besides the usage of jargon, most scientific publications only use basic arithmetic that is learned in elementary school. I think it is crucial for everyone to have a fundamental understanding of scientific publications in this so-called “scientific” age. There is so many news everyday reports “scientists have found that…”, some of them are true and some are not. In 1997, a study has linked the vaccines to autism. Even though later, the study was disqualified. The idea that “science has proven that vaccine is causing autism” is still deeply influencing the decision of many parents. Indeed, what should we believe and what should our decisions be based on, when science discoveries can so often contradicting themselves? In the early 20th century, it was wildly believed by doctors that smoking cigarettes are good for human health. During WWII, there are more combatants from the U.S. that died from cigarette smoking than combat along. In an information age, it is easy to grow passive and trusting the experts to tell us what to think and what is right. But I think in a time that, for most of us, our understanding of the universe is no longer coming from first-person observation, but the conclusion of others drawn from data they collected and presented. From what is the healthy food to eat, to what is a good car to buy, or what is a good life to have, the information we have shapes what decisions we make, and how we live. That is a lot of trust we put into those experts. So let’s try to understand how those conclusions were drawn and can we actually trust them, together.
Basic probabilities
Most of the scientific theories nowadays are based on probabilities. The mathematics of probabilities concerns with calculating the likelihood of events happening. As popularized by Mark Twain, “There are three types of lies – lies, damned lies, and statistics.” Sometimes probabilities align with our day to day intuition, but more often they contradict our day to day understanding of the universe.
One of the simplest probability examples, is a coin flip. In most of the models, we call outcomes as events. In the context of coin flipping, there are two possible events associated with a coin flip: head or tail. I want to note the reader that mathematics does not tell us why the world works in this way, but simply provide us with a model for describing the relationships between our observations. In this case, this binary model, head or tail, leaves out the possibility that a coin might stand on its side when flipped. But in general, only head or tail is a good enough approximated model for reality (as it provides an accurate prediction for the observed coin flip distributions). The probability of head in a toss is denoted as P(head), and the probability of tail in a toss is denoted as P(tail). Because a coin flip must either be head or tail (we have eliminated other possibilities in our model), we say that:
P(head or tail) = 1
That is, a coin flip is 100% time results in either head or tail. Also, we know a coin flip can not be both head and tail, that is, the two events are mutually exclusive, we have
P(head and tail) = 0
Using the famous Venn diagram:
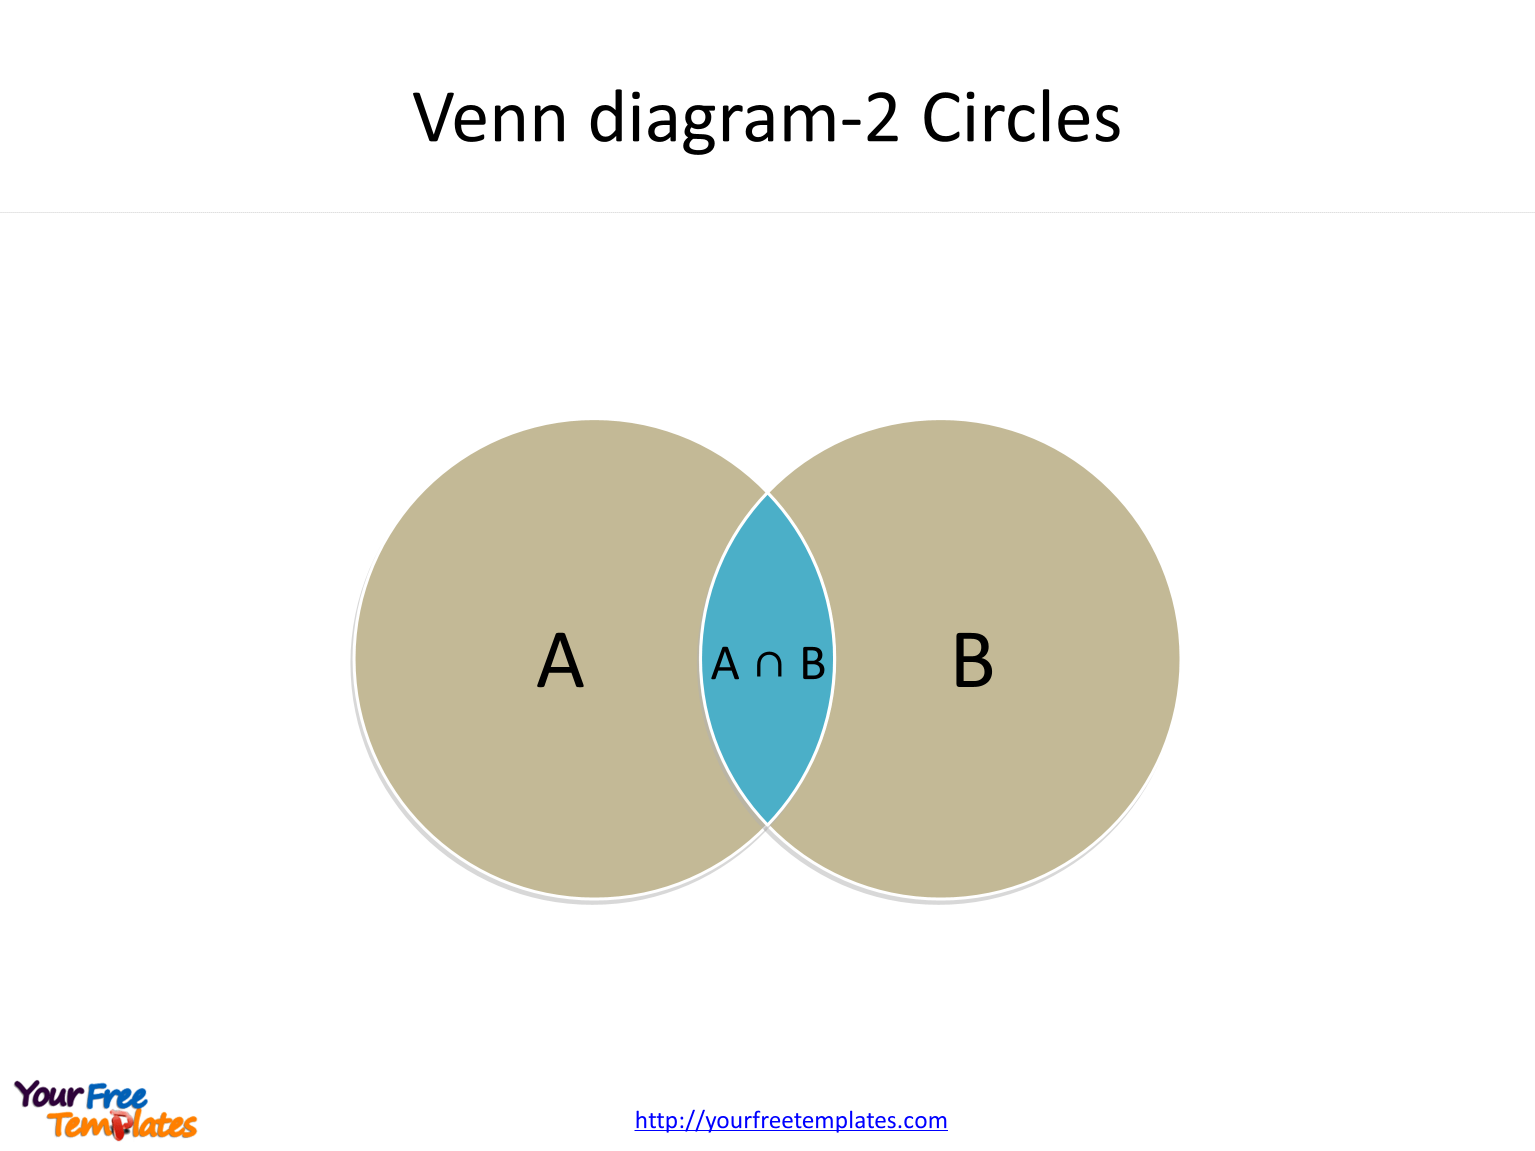
P(head or tail) = P(head) + P(tail) – P(head and tail) = P(head) + P(tail) = 1
Here we only care about the result: P(head) + P(tail) = 1.
For a fair coin, we would say that it has an equal chance to get heads and tails. That is P(head) = P(tail). So we can easily calculate that for a fair coin, P(head) = P(tail) = 0.5. 50% chance head, 50% chance tail.
That concludes the basic concepts of probability. Before we proceed, we will need another concept, conditional probability. It is usually denoted as P(A | B). It reads as the probability of A given B. That is, what is the chance of A occurring if we know that B has already occurred. From the Venn diagram above, we can see that

To give the reader a little more intuition, thinking about we are randomly taking a point from the diagram above. If we know that the point must be in circle B, what is the probability it is also in the circle A? If we sample the point uniformly, we can use the area for the calculation that is P(A | B) = Area(A and B) / Area(B). If we divide both top and bottom by the Area of A or B, we have

For the purpose of the following discussion, the only thing the reader needs to remember is the conditional probability equation, otherwise known as Bayes rule:
Hypothesis Testing (or P – Test)
Now let’s say that we have a coin, we want to test the following hypothesis:
The coin we have is unfair.
But how can we “prove” our hypothesis? Hypothesis testing (or p – test), uses a method called reductio ad absurdum. It is a fancy Latin phrase, but we all have used it in argument sometimes, even though we may not realize it. It’s more commonly known as proof by contradiction. For example, your friend makes a bold claim, that “All ravens are black!”. So to prove that he/she is wrong, you go to the wildness, spending 7 days and 7 nights, finally found a white raven, and returns triumphantly, showing that your friend claim is wrong. But in the case of a coin, how can we know that if the coin is fair or not by simply flipping it? As long as the chance of head or tail is not zero, any sequence of outcomes is possible. This shows the first problem with Statistical hypothesis testing:
In contrast to traditional prove by contradiction, statistical hypothesis testing does not tell us that our hypothesis is wrong, just that it is unlikely (by some measure).
Keep this in mind, that an unlikely event can still happen. Statistical hypothesis testing does not tell us anything for certain, most importantly, it does not tell us, that the hypothesis is true.
Instead of seek to contradict our hypothesis, for statistical hypothesis testing, we actually seek to contradict a null hypothesis. It is just a fancy name, means the opposite of the hypothesis. Because our hypothesis is:
The coin we have is unfair.
The null hypothesis is:
The coin we have is fair.
Notice that the hypothesis and null hypothesis must be mutually exclusive and complimentary, which means one of them must be true, and they can not be both true. (The same holds also for the head and tail outcome of a coin flip. They can not be both true, and one of them must be true). In probability terms:
P(hypothesis) + P(null-hypothesis) = 1
P(hypothesis and null-hypothesis) = 0
So, to show that the null hypothesis is unlikely, we flip the coin 5 times. We got 5 heads! The p-value is defined as:
p-value = P(data | null-hypothesis)
So in our case, the null hypothesis is that the coin is fair and the data is 5 heads in 5 flips. We can calculate our p-value as 0.5 * 0.5 * 0.5 * 0.5 * 0.5 or 3.125%. Usually, we choose 5% as our threshold (it is an arbitrary choice) and say we reject the null hypothesis.
But wait, the p-value is the probability of the data, says nothing about the probability of the null hypothesis itself. Why should we reject the null hypothesis solely based on the unlikelihood of data? Well, we shouldn’t. We should reject the null hypothesis based on the unlikelihood of the null hypothesis itself. Here, we can use the Bayes rule:

The formula above shows a problem, that the experiment tells us p-value that is P(data | null-hypothesis), but we have no idea P(null-hypothesis) or P(data) is. So, I am going to make up some data here, as scientists sometimes do. Let’s say that I have examined all of the coins in this world and 99% of them are fair, i.e. P(null-hypothesis) = 99%. And I have flipped enough coins many many times that I can confident to say that P(data) = 3.125%. It is not a surprising number, as that we have established that most of the coins in this world are fair, so the chance of getting 5 heads in a row with a random coin, is about the same as the chance of getting 5 heads in a row with a fair coin.
We can calculate the probability of the null hypothesis given the data now:

So, we see that even though p-value says that the probability of data given the null hypothesis is very unlikely, but we can not conclude that the null hypothesis itself is unlikely given the data! That is, we can NOT say that our original hypothesis is likely to be true! I can’t stress the following statement enough:
p-value does not and can not inform us about the likelihood of our hypothesis
Reproducibility
What can tell us the likelihood of our hypothesis is reproducibility. In this section, I will show how reproducibility provides us with insight into the correctness of the hypothesis, and it is not peer review or experts’ claim, but ultimately reproducible results that ensure the validity of scientific hypotheses.
Mathematically speaking, reproducibility increases the empirically observed probability of the data, we denoted P(data). The key reason that the small p-value did not translate to a small likelihood of the null hypothesis, in the equation above, is that P(data) is really small. Reproducibility is evaluated by P(data). A perfectly reproducible result will have P(data) = 1. For the sake of argument, 90% of people were able to reproduce our result, i.e. P(data) = 90%. Putting the number to the equation above, we can recalculate the likelihood of our null-hypothesis.

Furthermore, we know that P(null-hypothesis) is always less than 1. So we can drop it in our calculation to get an upper bound:

That is, given the data, our null-hypothesis is only 3.472% likely to be true. Or alternatively, our hypothesis is 96.528% likely to be true. For those who are familiar with Bayesian statistics, P(null-hypothesis) is called a prior. But it is shown here, with good reproducibility, the prior has a very small influence towards our confidence in our hypothesis. The prior, that is our existing bias towards the likelihood of the hypothesis, has little to none influence on our conclusion about our hypothesis when we are conducting sound science. After all, scientific discoveries should be objective and do not depend on our individual prior beliefs.
Most scientific studies, of course, would involve more complex data, and more sophisticated models. But regardless of their sophistication, they are still subject to the same issue: Without being reproduced, we can not make probability claims about the data, i.e. P(data), with a sample size of one, and by extension, the validity of our hypothesis, no matter how much we feel that hypothesis is true, or how much sense that hypothesis makes.
Epilogue
Scientific theories are made and evaluated by humans, they are also as fallible as we are. I think that a good education should aim to arm us with the tools that we need to judge the validity of the information we encounter, not to enable us to be another cog in this gigantic economic machine, or at least, not simply so. It may be difficult, but I think it is crucial for each of us to, at least try to, not only look at the conclusions we read on the news, but also look at the data they provided, and how the data was gathered, and apply our own reasoning to see if we can draw the same conclusion using the data. And if our conclusion is not the same, we should also try to identify why. It is a lot of work for every piece of information we encounter. But in a digital age, that we can both so easily get information, but also share them to thousands of people at ease, I think it is important, for our epistemological responsibility, not only to verify the information we acquire, but also to do our best to prevent the spreading of false ones.
As a final note, I want to say that science only tells us the correlation between observations. It does not and can not tell us why. Newtonian mechanics tells us the relationship between force and velocity, but it does not tell us why does the force change the velocity. Quantum mechanics tells us the relationship between the wave function and the observed distribution of the particles. This is also true to other scientific theories. They only tell us about the relationships of different observations. As for the why, that is all human interpretation and our attempts in making sense of the world. I hope that the reader can keep that in mind when reading about any scientific works.
Question 1. A smart reader would probably realize that any sequence of 5 coin flips (HTHTH for example) of a fair coin is 3.125%, which means any sequence will be statistically significant. Does that mean any sequence can be used to justify that the coin is not fair? I will leave the question for the reader to contemplate.
Question 2. Per Karl Popper, a key component of scientific method is falsifiable, that is, for scientists to try their hardest to disprove their hypothesis. Shouldn’t we seek to reject our original hypothesis, instead of the null hypothesis? Or is p-test seek to confirm our hypothesis instead of falsifying it?
